1 minute readFixed
Model Profiling shows only what your profiling server reports
The Model Profiling page no longer shows six sample backends, a sample GPU and a sample latency histogram. It reads your profiling server, and says so plainly when none is connected.
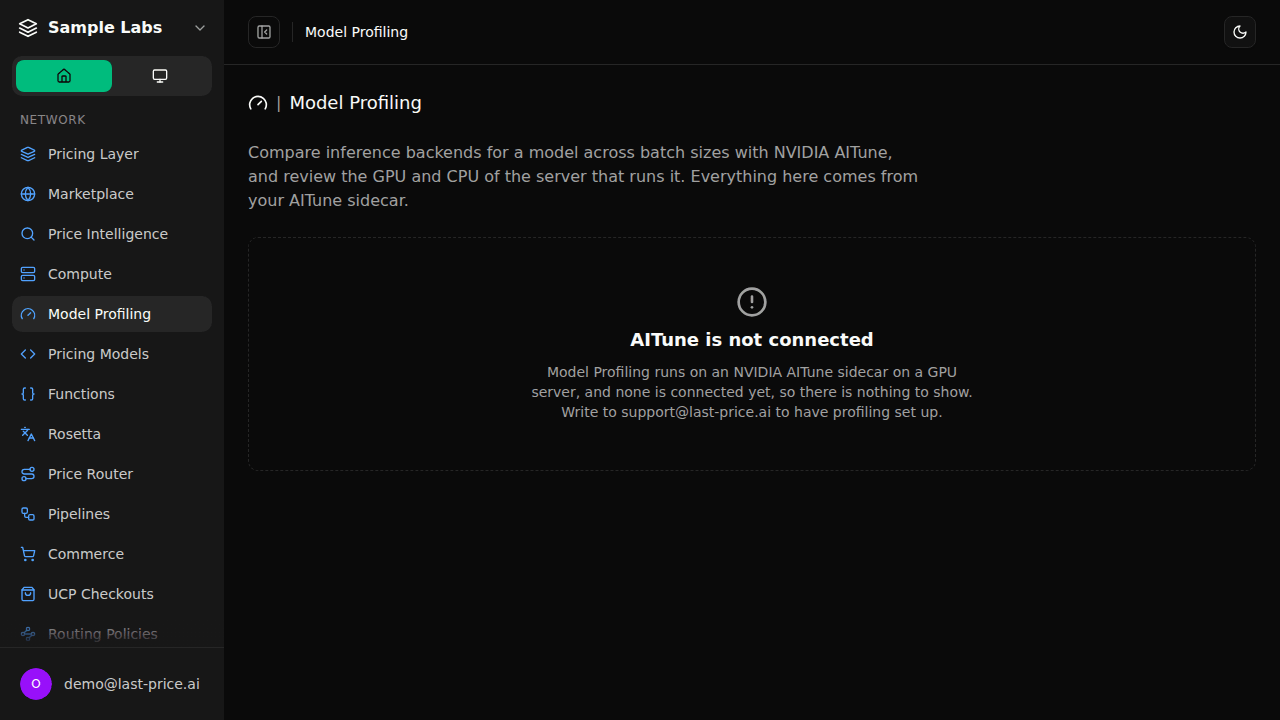
The Model Profiling page used to open with invented results for every workspace: six backends, a GPU at 72% use and a latency histogram, although no profiling server was connected. Its model list and Run Profiling button did nothing.
- With no profiling server connected, the page says so and shows no numbers. Write to support@last-price.ai to have profiling set up.
- With a profiling server connected, the System tab shows its real GPU and CPU, and you name a model to load its report or start a profiling run.
- The latency histogram is the server's own measurement for that backend and batch size, or a message saying it has none, instead of a scaled guess.
- If the server cannot be reached, the page says so with a Try again button.