2 minute readDesignAgent-ready
Charts of what we ship on the release notes page
The release notes page now charts everything we ship: a weekly chart by category, the overall mix of work, who each release is for, and a calendar of release days.
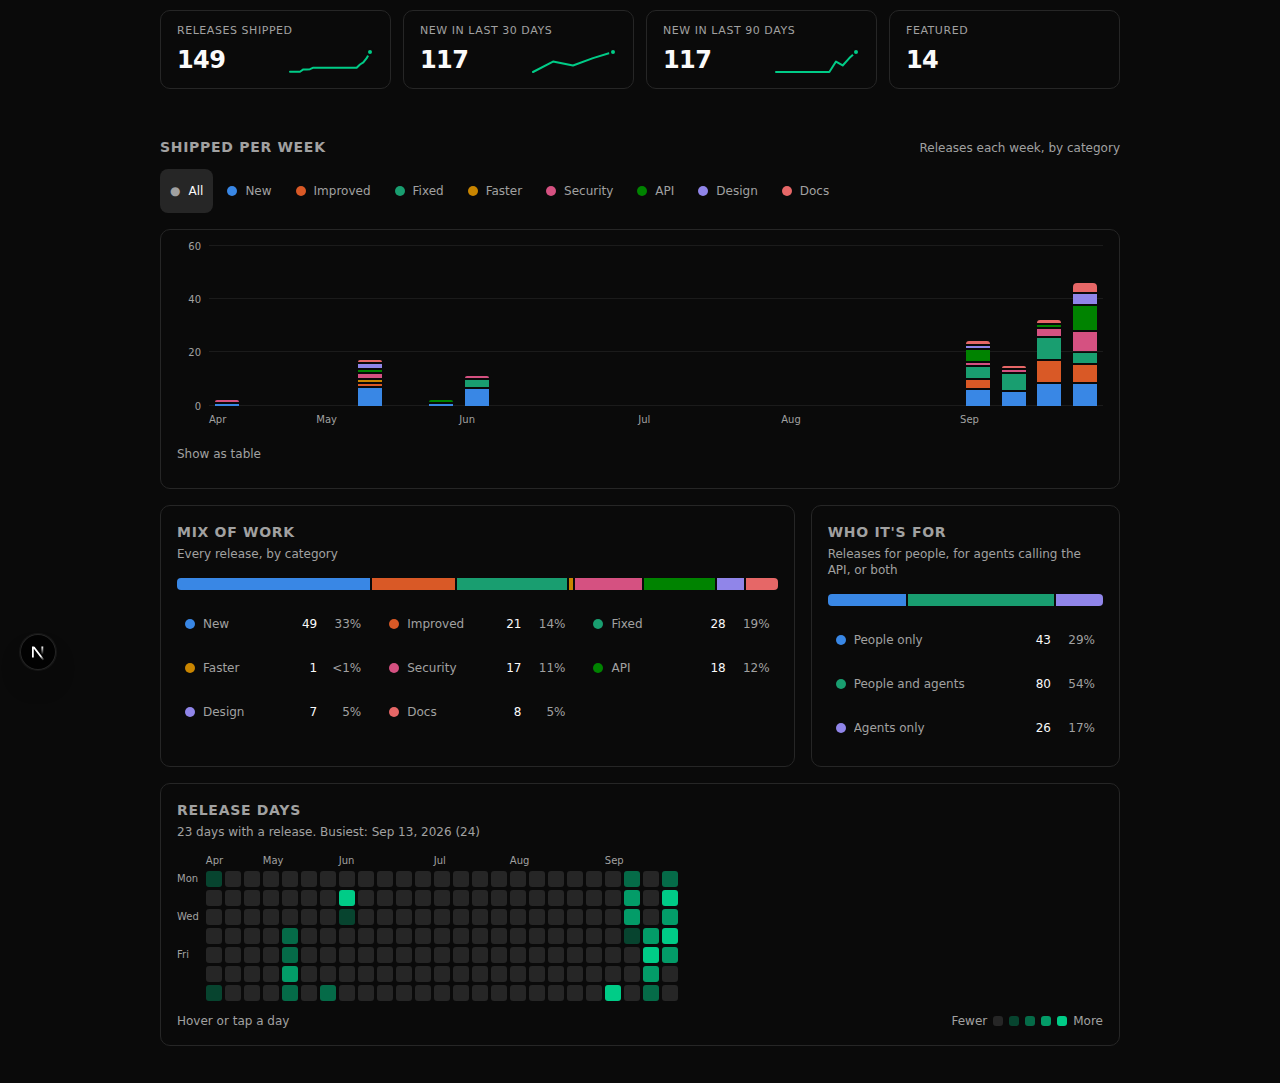
The top of the release notes page now shows the pace and shape of our work, not just the list.
- Shipped per week: one column per week, stacked by category. Hover or tap a week to see exactly what went out.
- Mix of work and Who it's for show every release by category and by audience: people, agents calling the API, or both.
- Release days is a calendar of the days we shipped, shaded by how many notes went out.
- The stat tiles carry small trend lines, and clicking a category in either chart filters "All releases" to it.
- A Velocity tile shows releases per week over the last four weeks.
- Filter "All releases" by month (pick several) and by who it is for, people or agents. Filters stay in the link, so a filtered view can be shared.
- Notes with a screenshot open with it as a large hero image, and every note shows its reading time.
- The dashboard home lists the latest release notes and how long ago they shipped.
- A table view lists the weekly numbers for screen readers and anyone who prefers figures to bars.